Sokompare
Kenya grocery price intelligence & smart shopping.
Deep analytics on Kenyan grocery pricing trends, inflation impact, and smart shopping strategies — powered by real market data. Sokompare tracks 593+ products across 23 categories from major retailers like Carrefour, Naivas, and Quickmart. It forecasts prices 60 days out, shows how your purchasing power has eroded over time, and optimizes your shopping basket to save you the most money.
The Problem
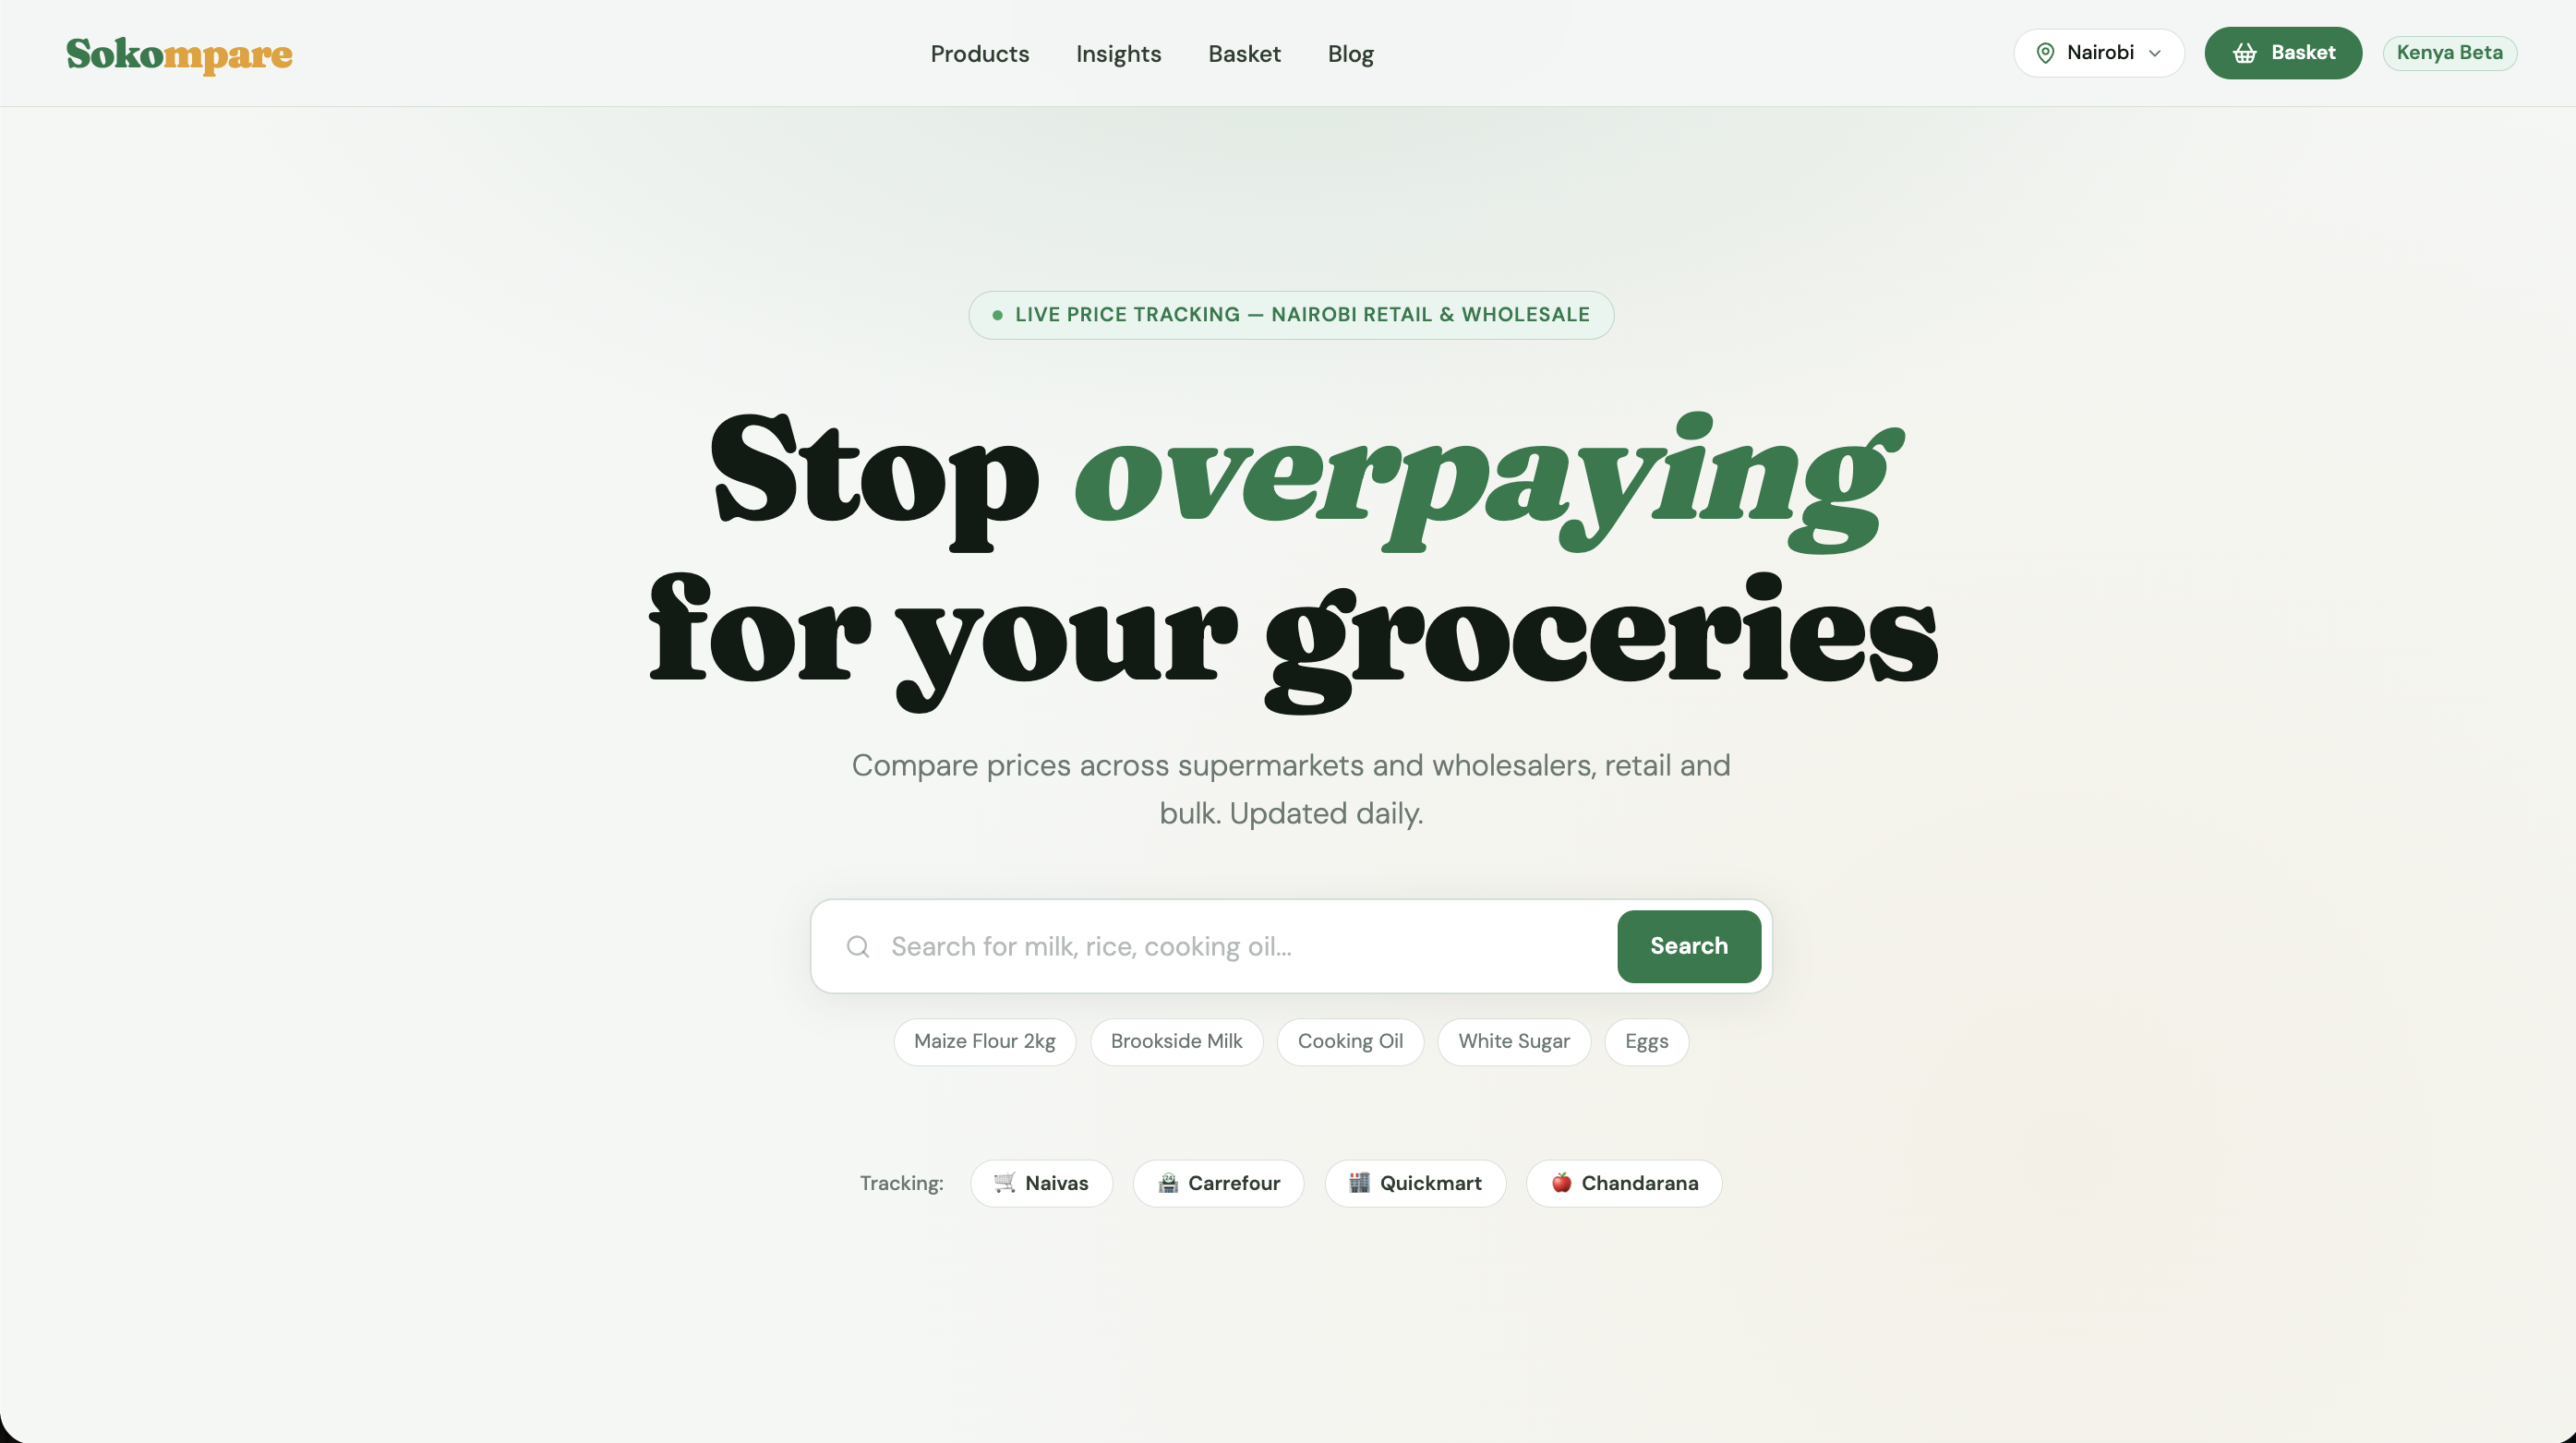
Grocery prices in Kenya fluctuate constantly — driven by inflation, seasonal supply shifts, and retailer pricing strategies. The average Kenyan household has lost 38% of its purchasing power in just 6 years. Most shoppers have no visibility into which store is cheapest for what, how prices trend over time, or when to stock up vs. wait. They're making blind decisions with real money.
How It Works
Price Tracking & Search
Search across 593+ products in 23 categories — from maize flour to personal care. Sokompare aggregates real prices from Carrefour, Naivas, Quickmart, and other Kenyan retailers, showing side-by-side comparisons so you can instantly spot the cheapest option.
Insights & Trend Analysis
An analytics dashboard showing average spending by category over time — beverages, dairy, grains, household, oils, and more. Filter by time range (1, 3, or 6 years) to see how prices have shifted. Surface-level stats like 8.4% average annual inflation and the biggest single saving (KSh 399) make the data immediately actionable.
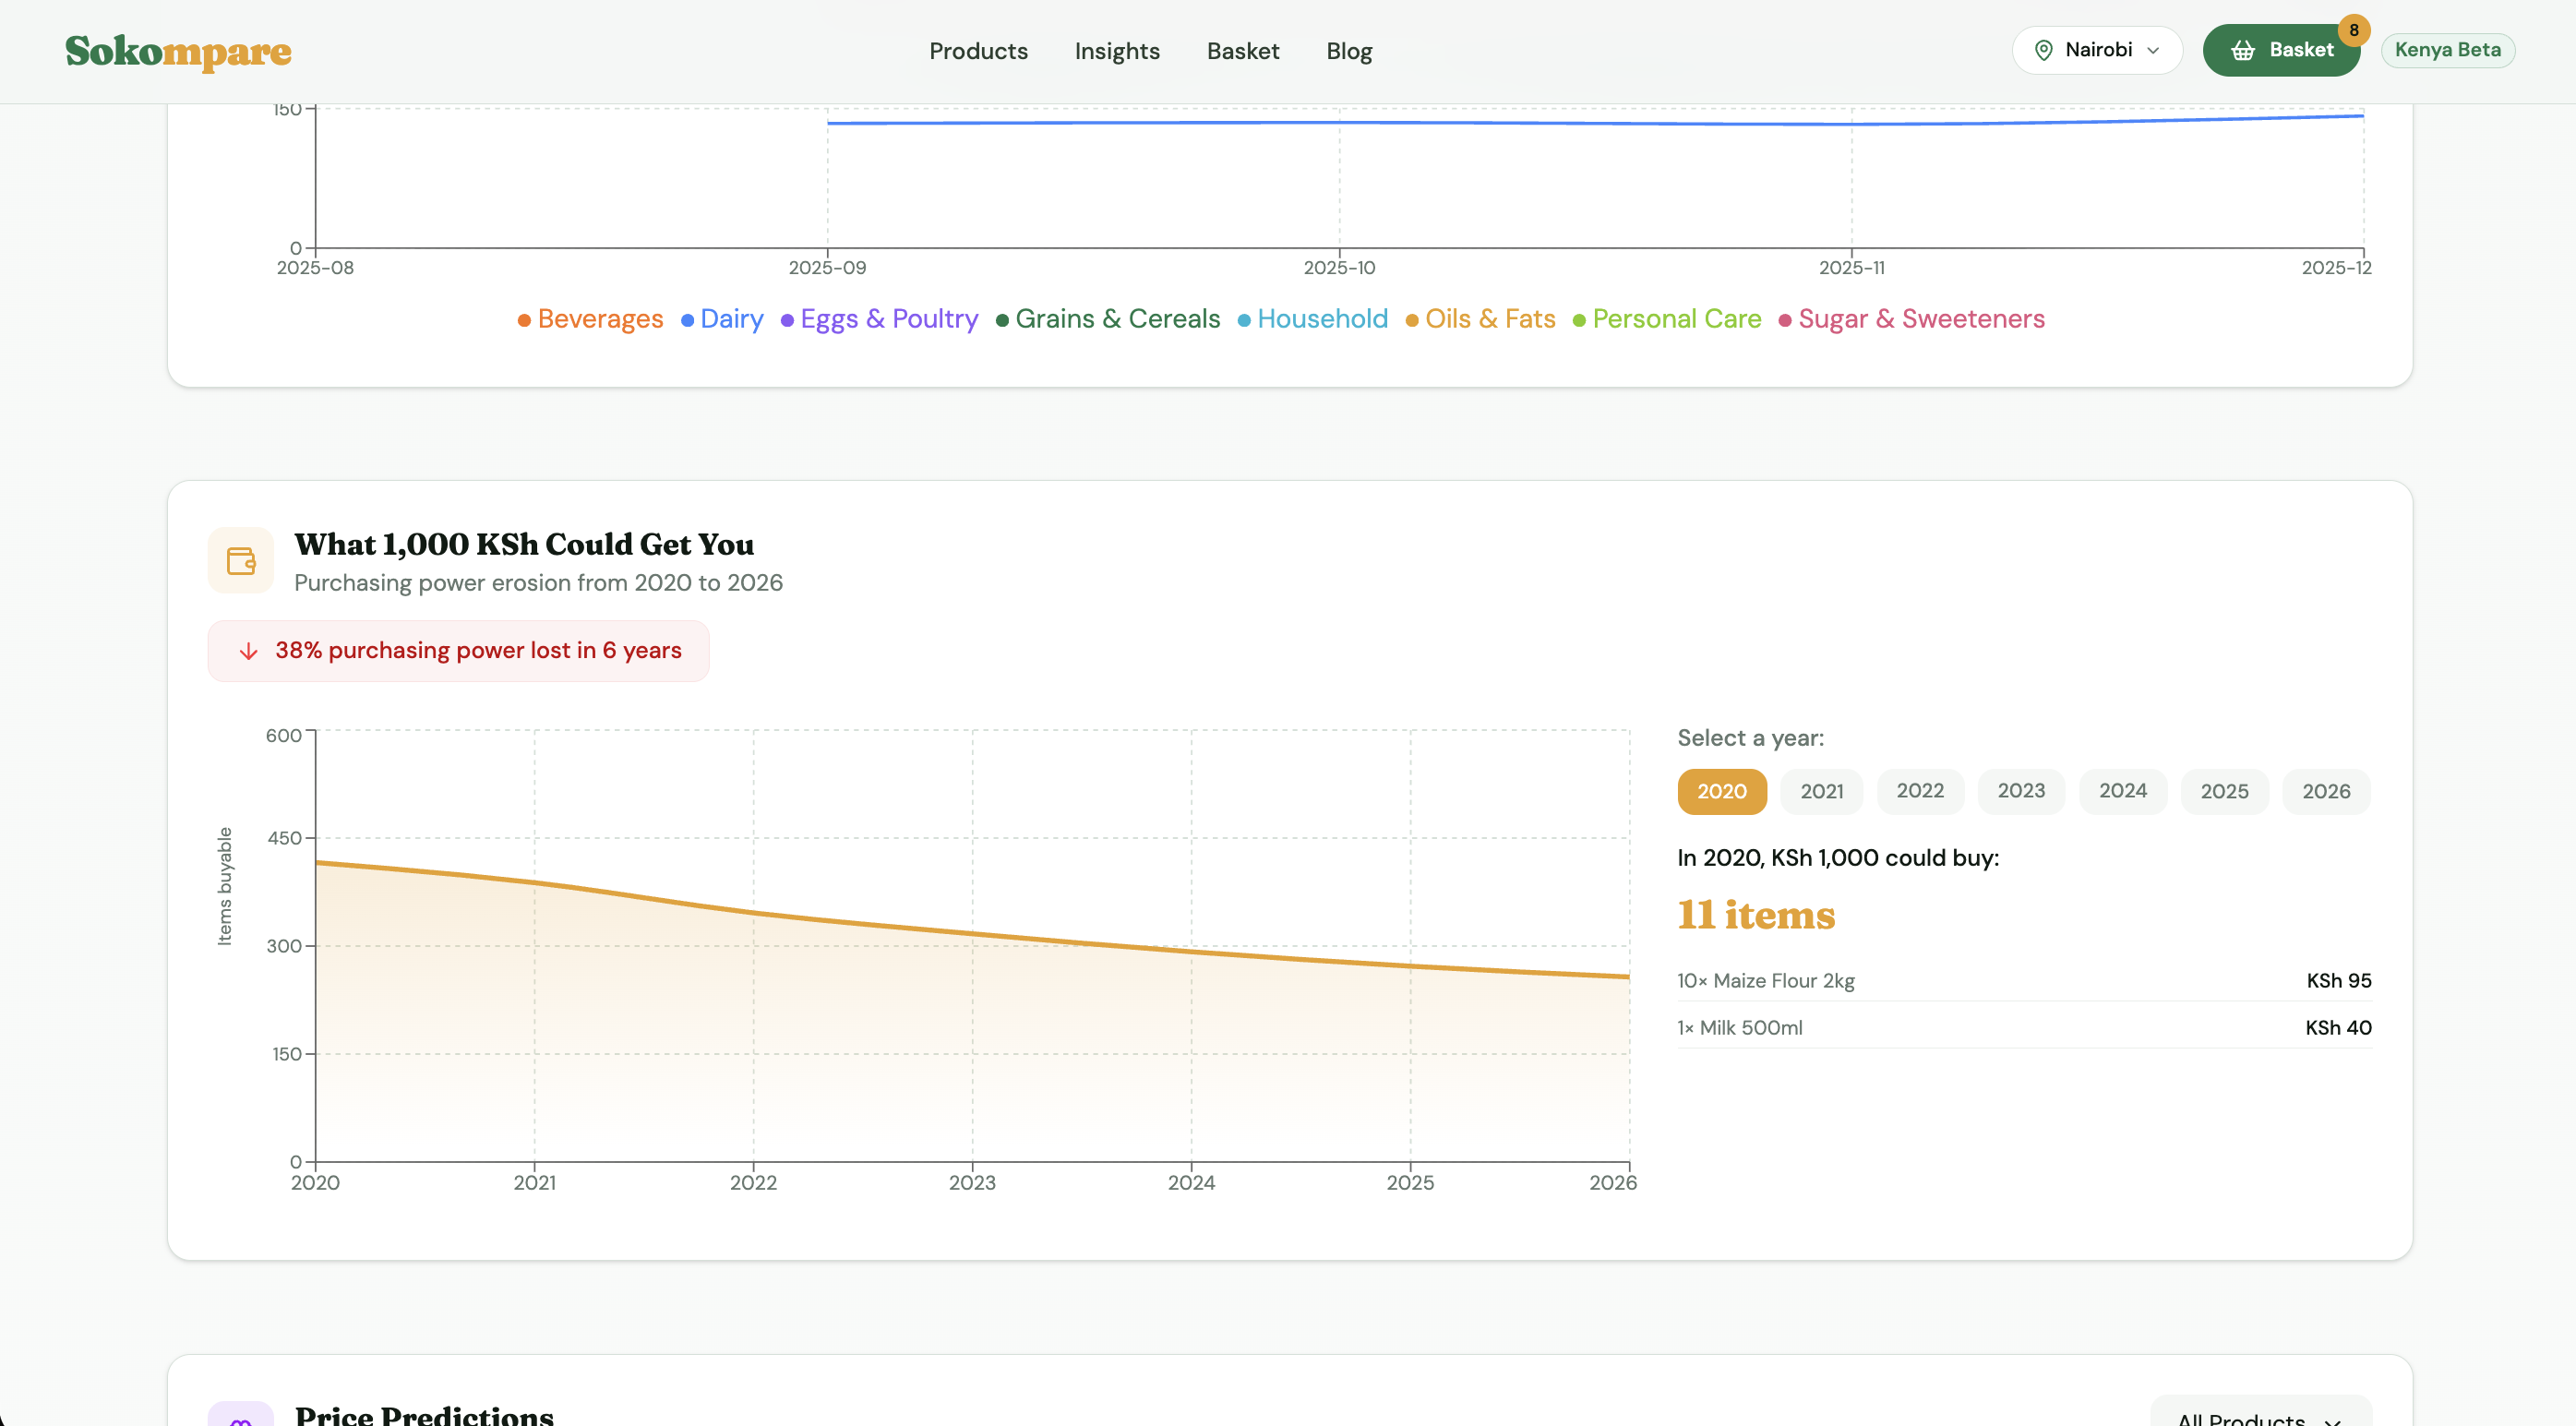
Purchasing Power Erosion
A visualization of what KSh 1,000 could buy in 2020 vs. 2026. The answer is sobering: 38% purchasing power lost. The tool breaks it down to specific items — showing exactly how many units of maize flour or milk your money gets you today compared to before.
60-Day Price Predictions
Exponential smoothing forecasts project prices 60 days into the future with confidence bands. See which products are trending up or down, which are losing demand, and whether to buy now or wait — backed by historical data, not guesswork.
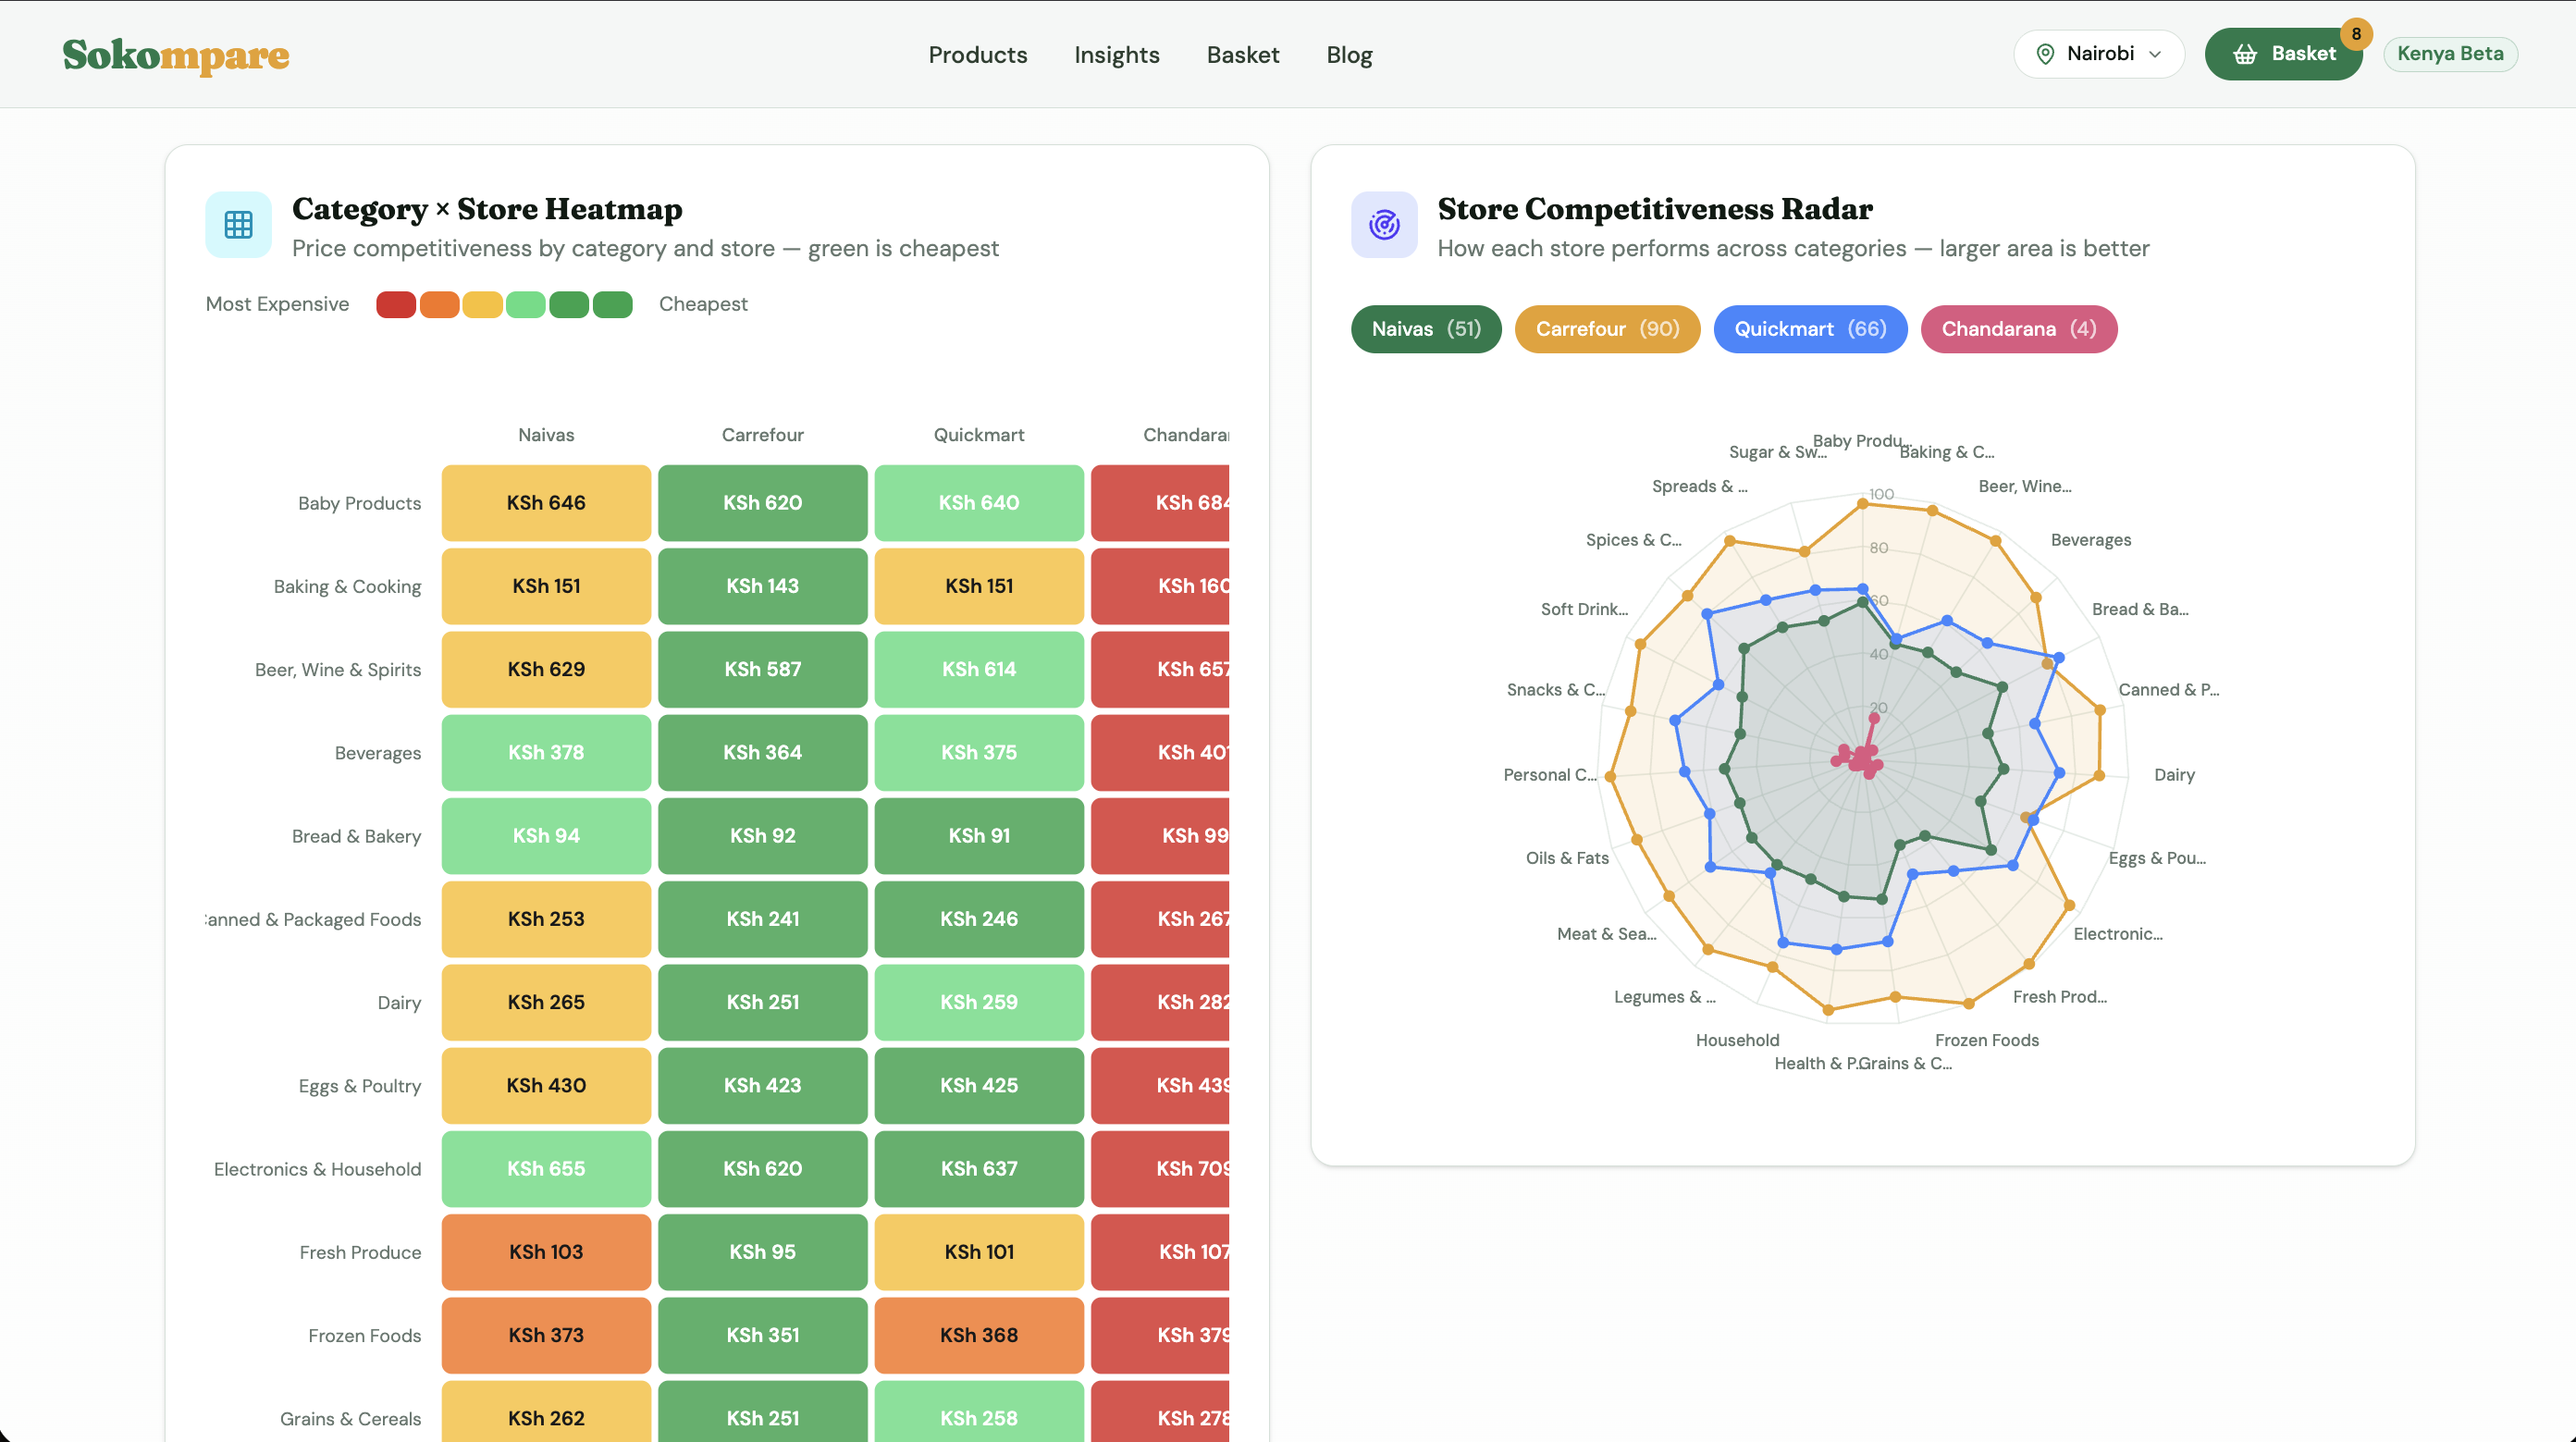
Category × Store Heatmap
A color-coded heatmap showing price competitiveness by category and store. Green means cheapest, red means most expensive. At a glance, you know where to buy dairy, where to buy grains, and which store to avoid for household goods.
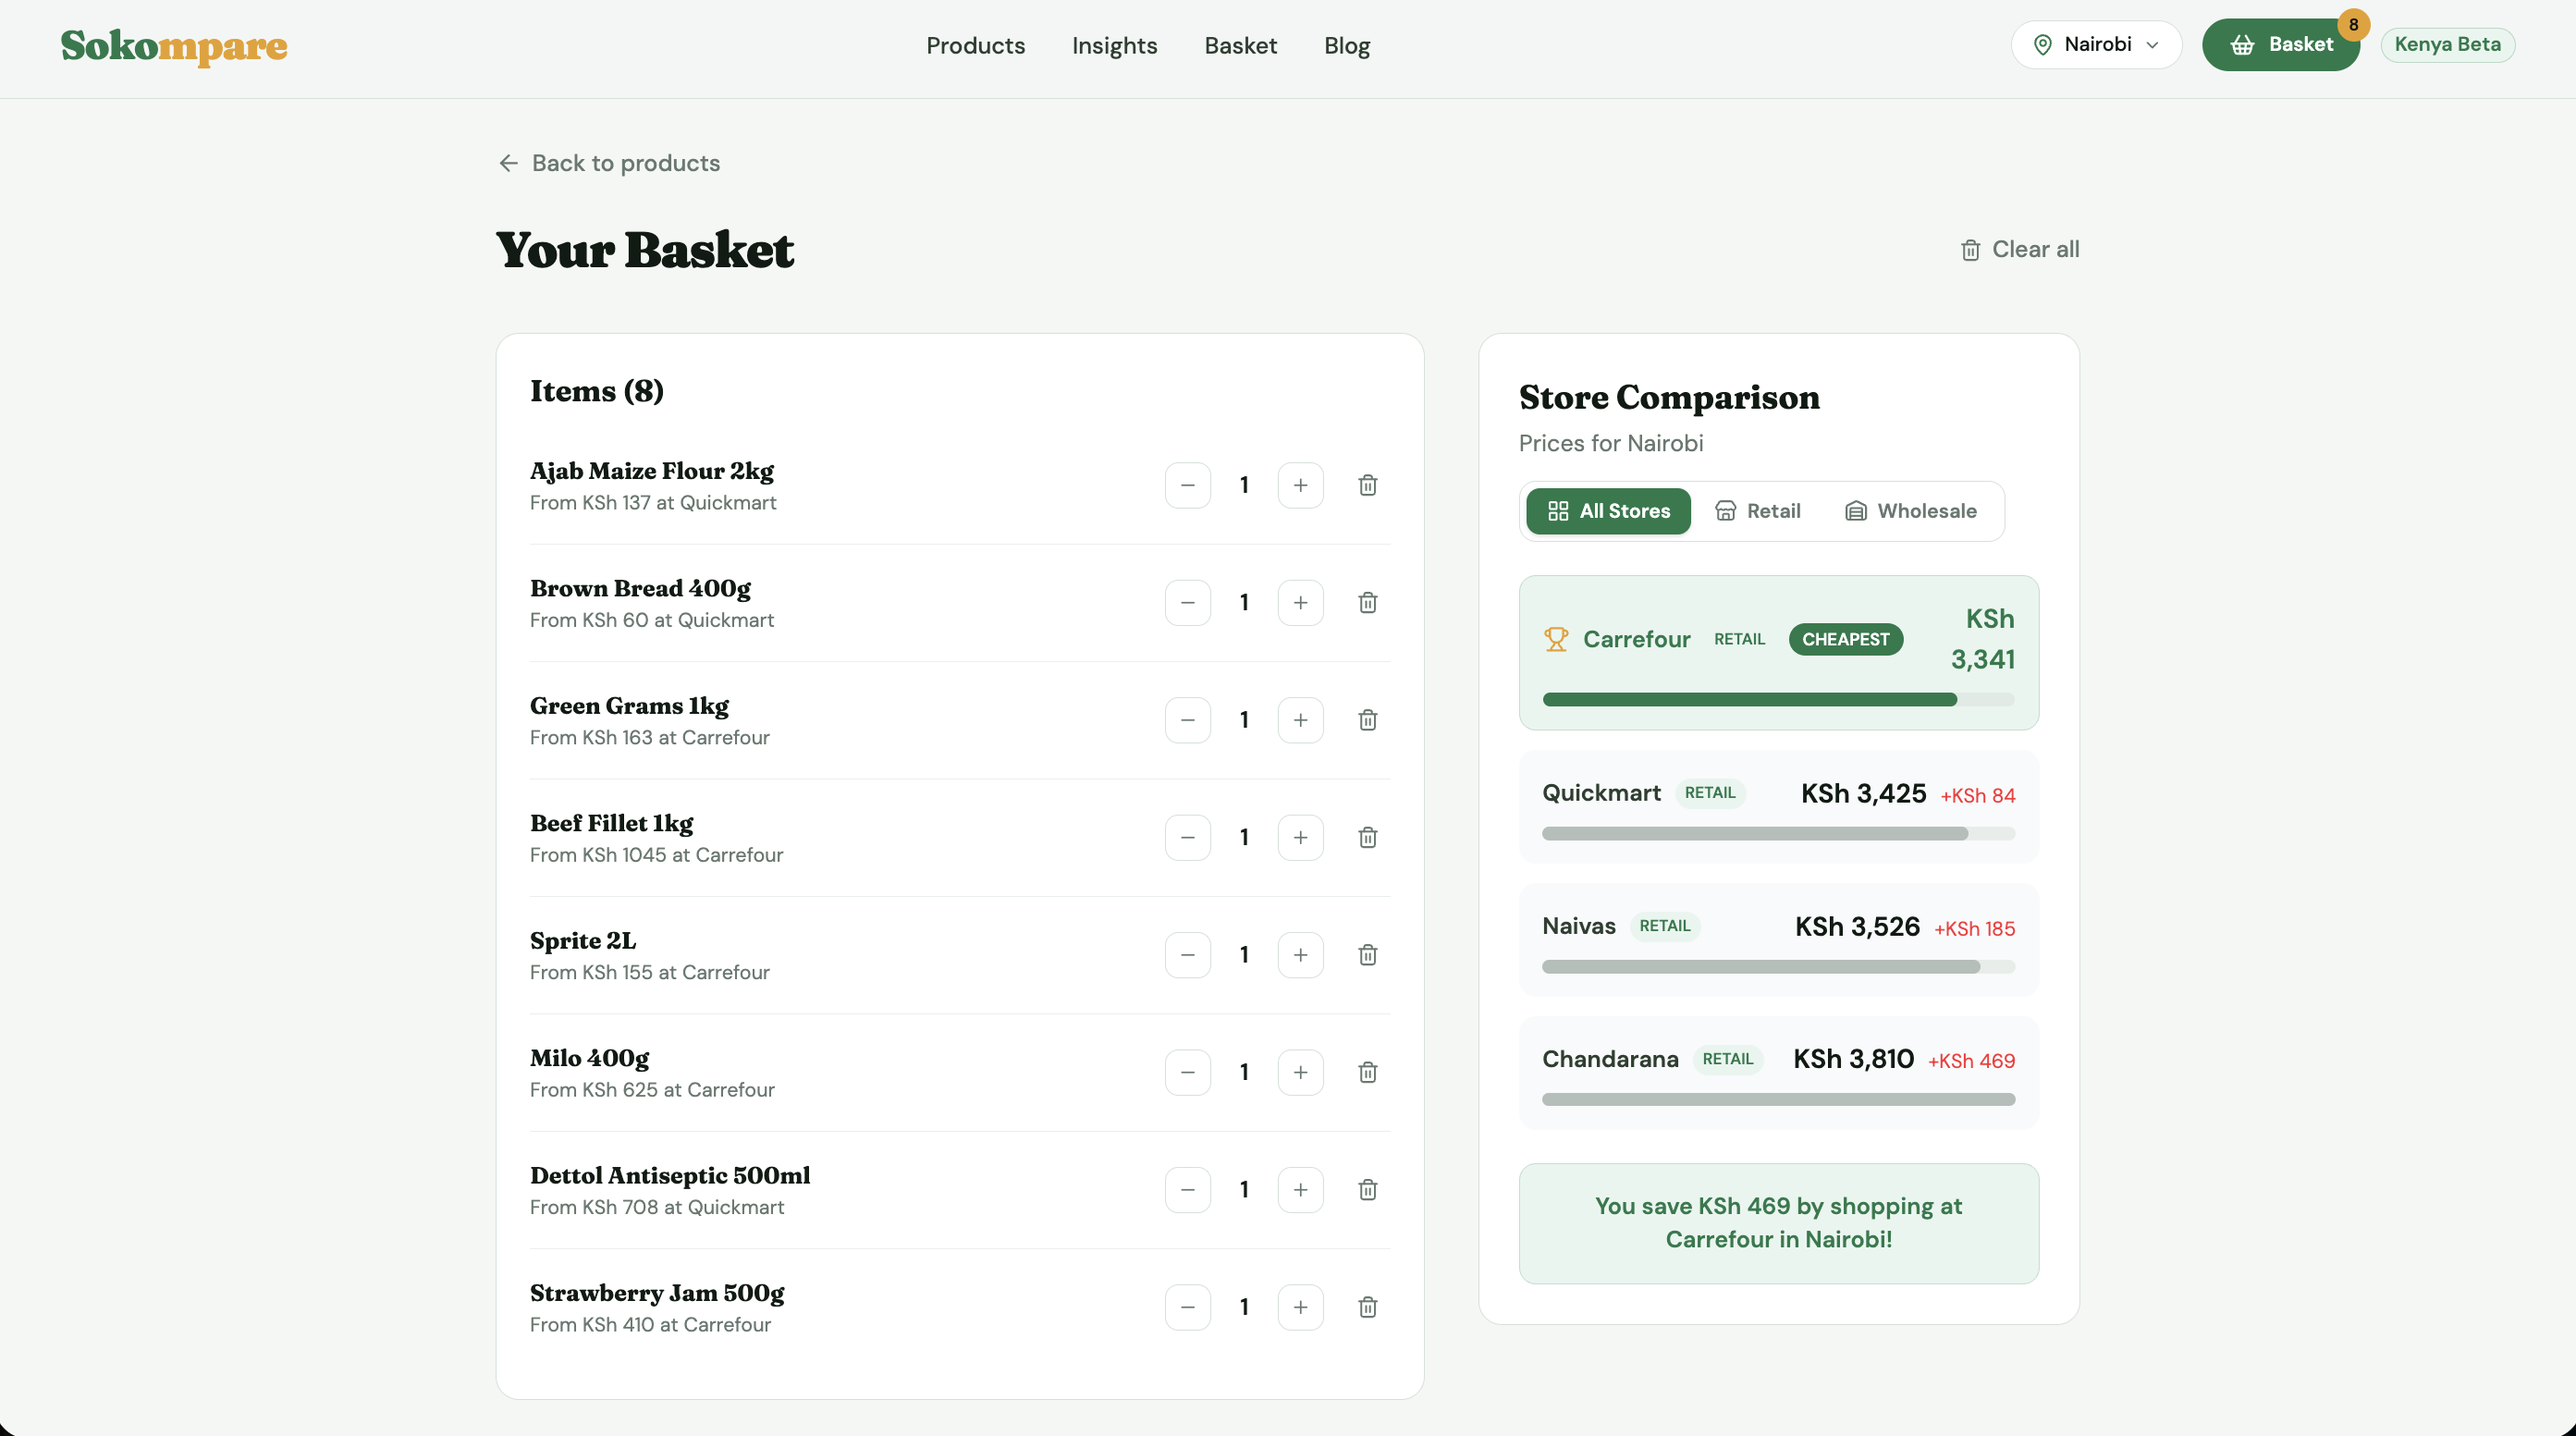
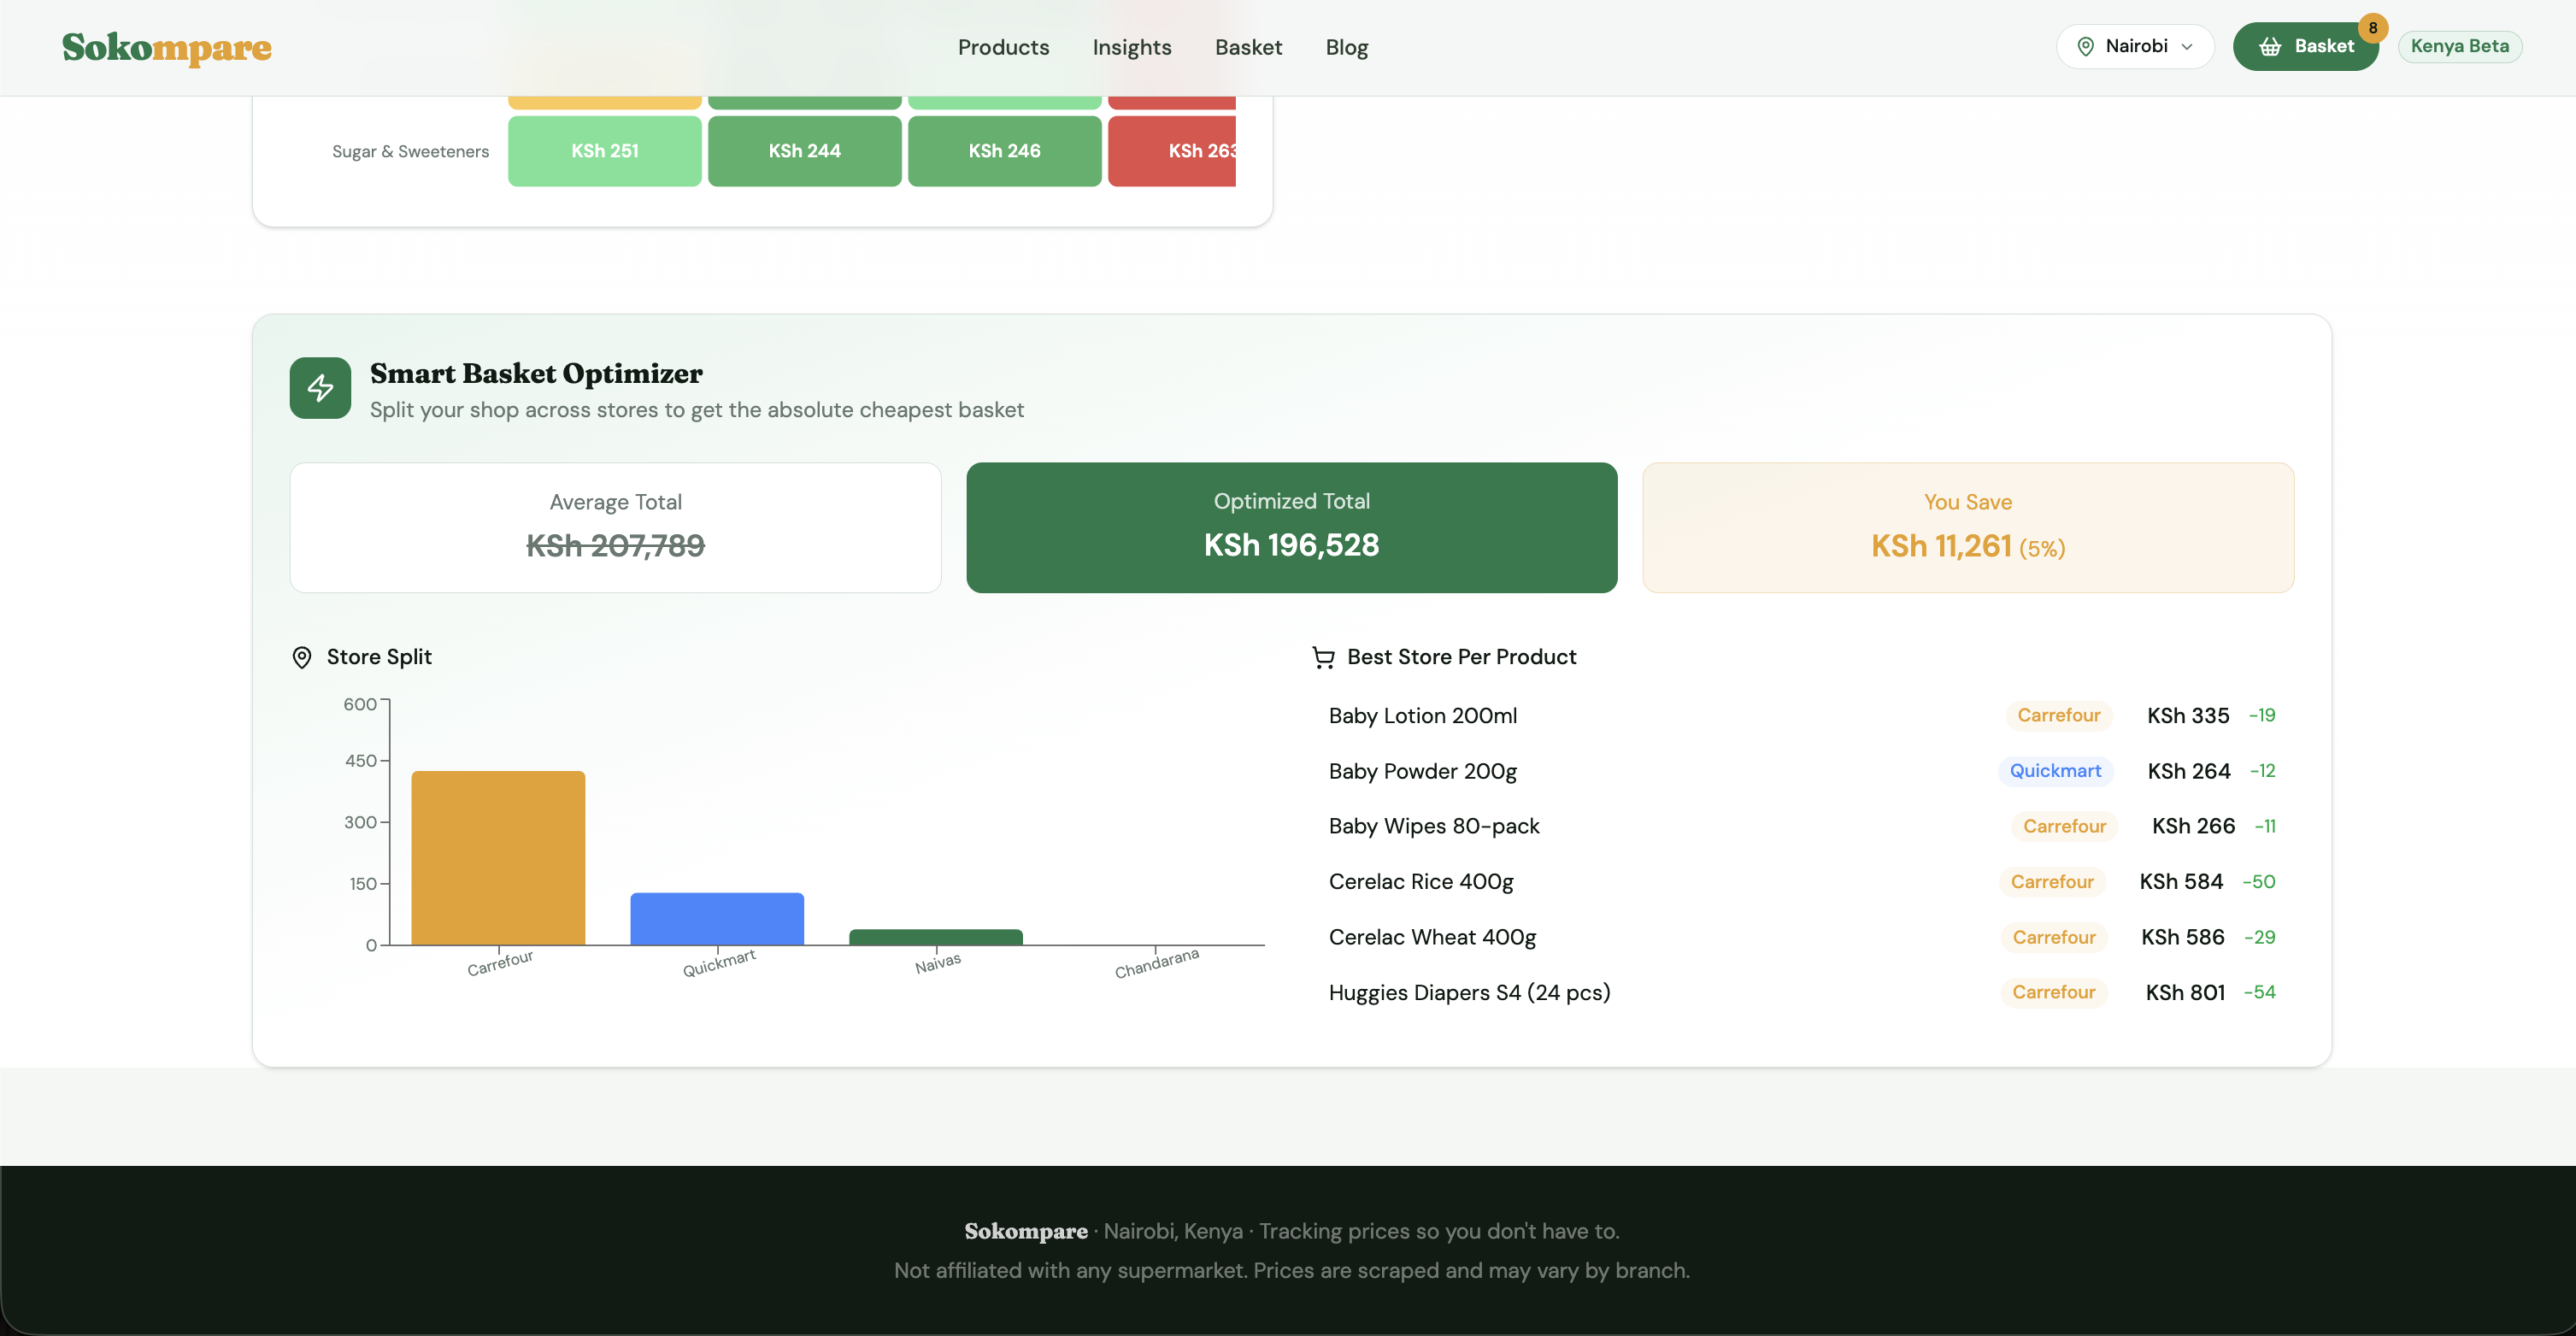
Smart Basket Optimizer
Build your weekly shopping list and Sokompare tells you exactly which items to buy from which store for maximum savings. It splits your basket across retailers intelligently — factoring in prices, availability, and the practical trade-off of visiting multiple stores.
Screenshots
Homepage
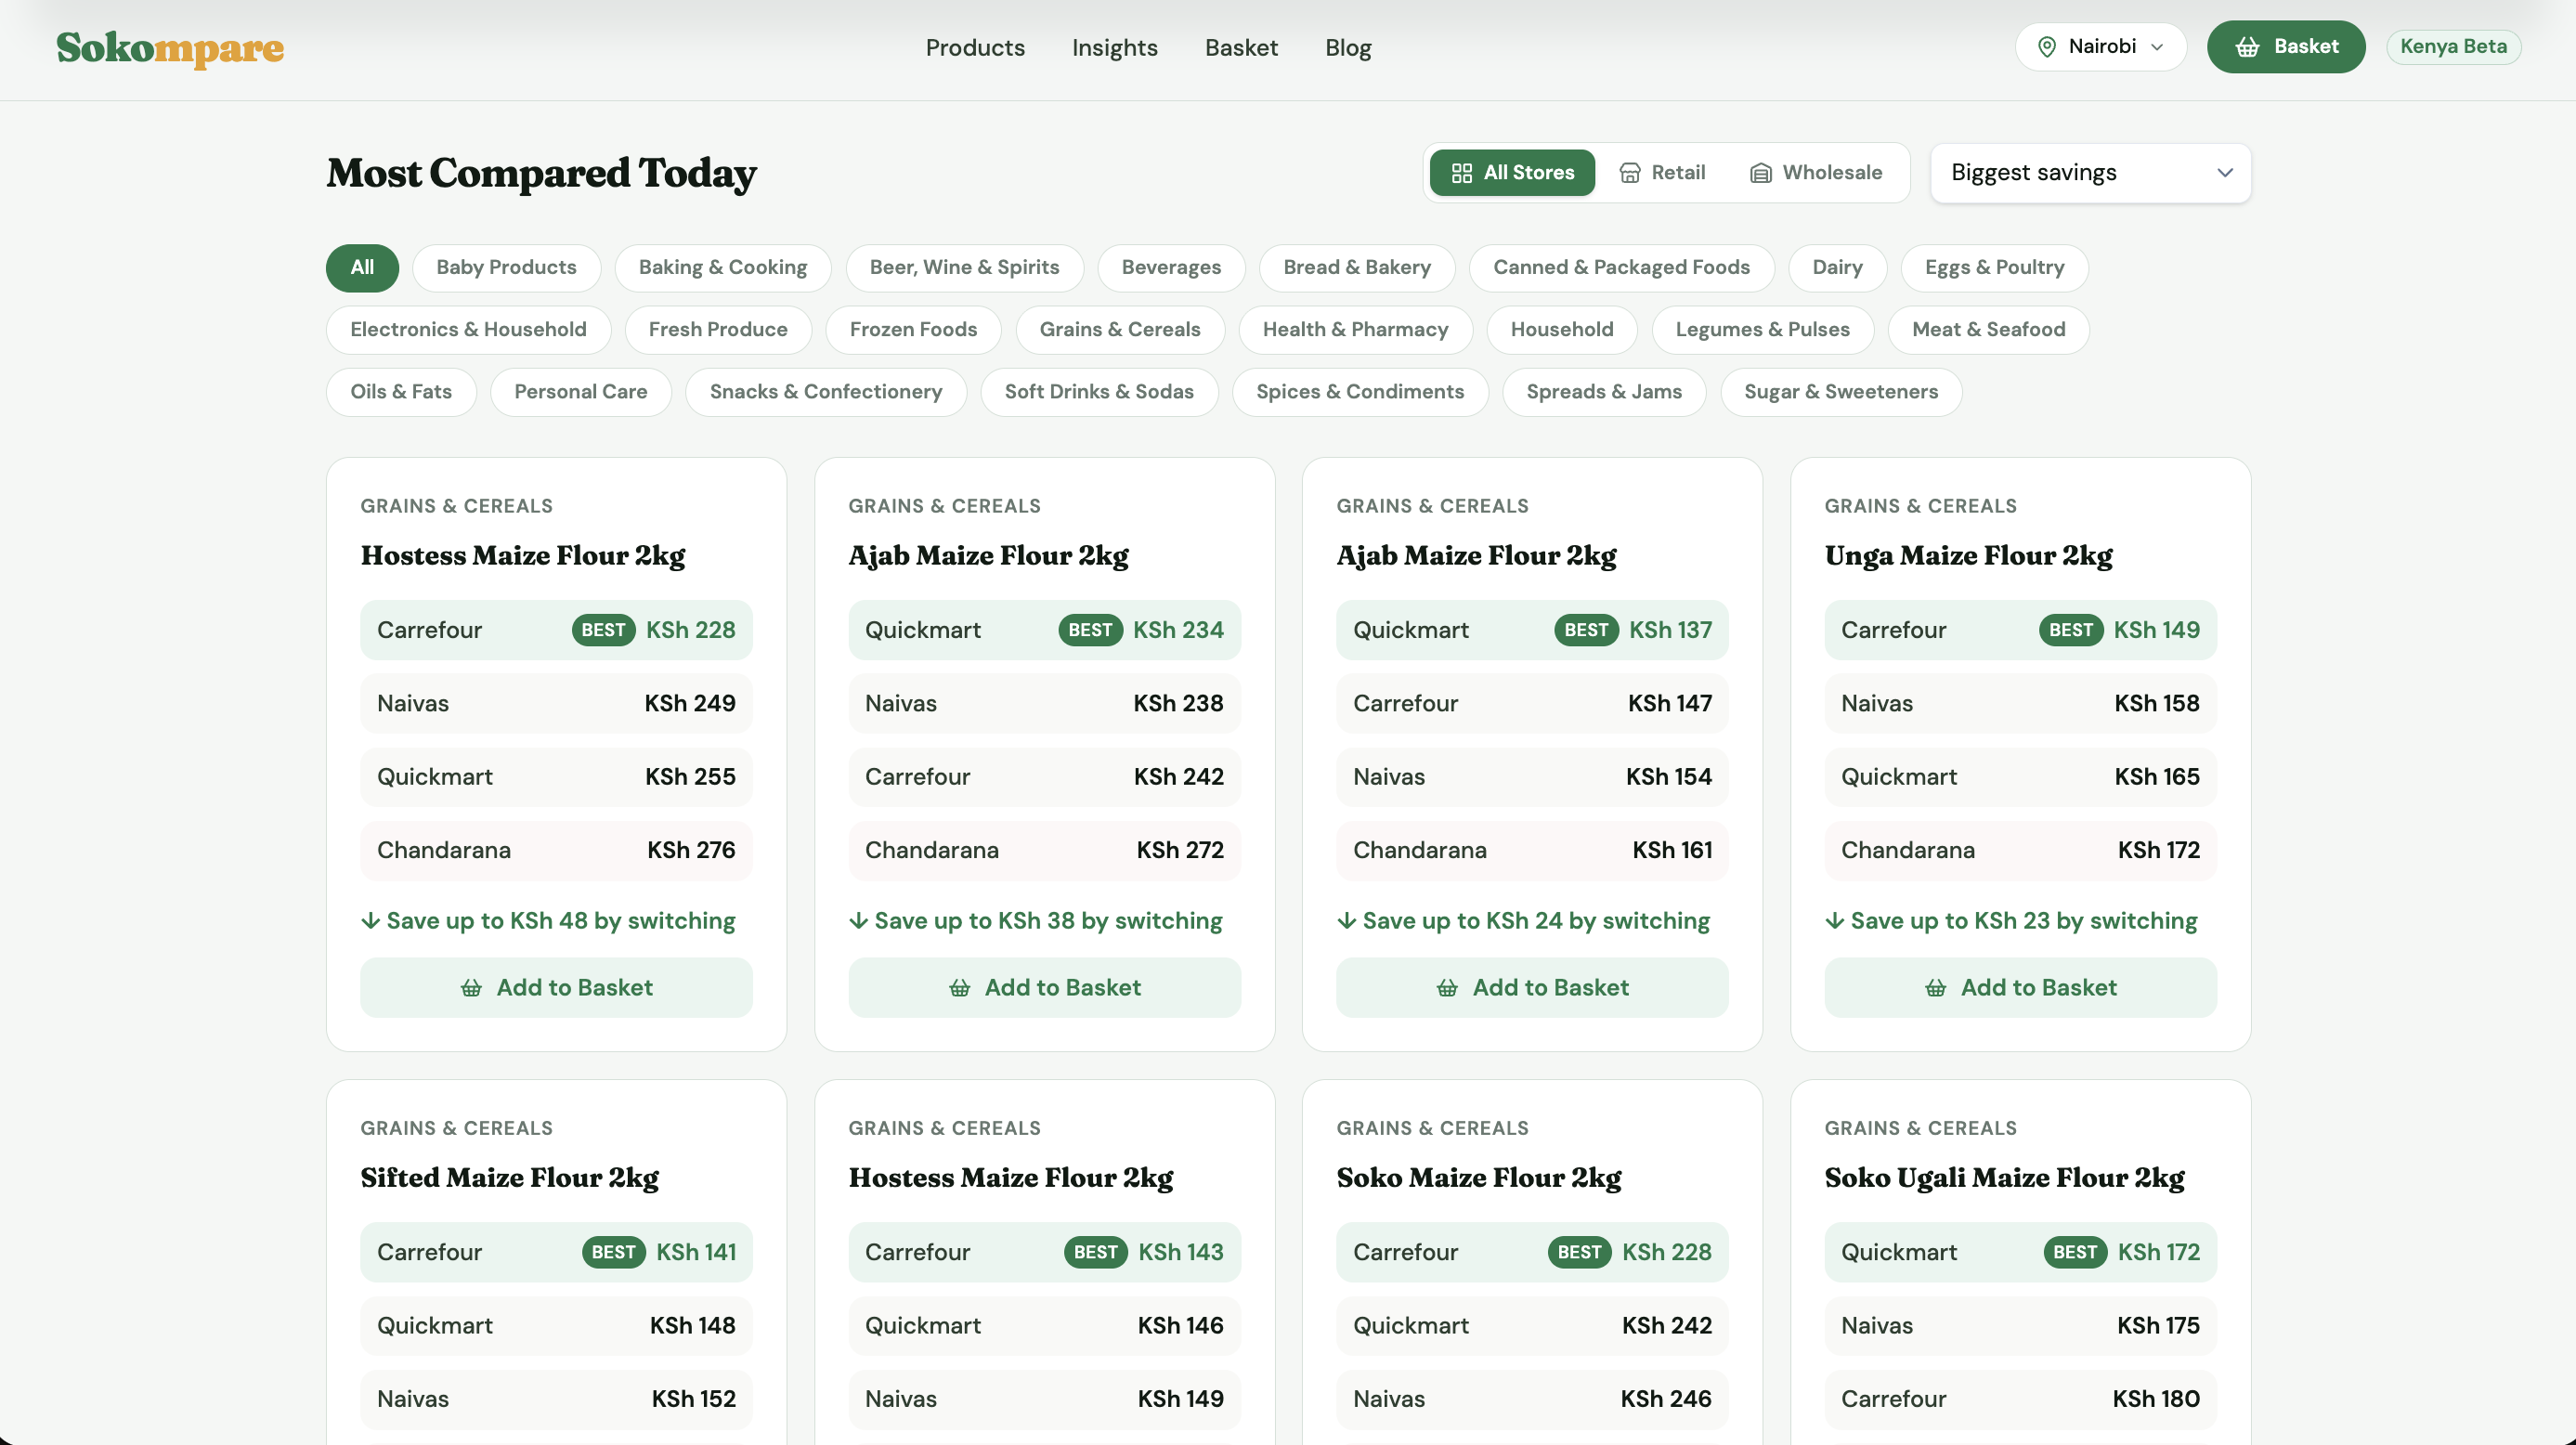
Product Search
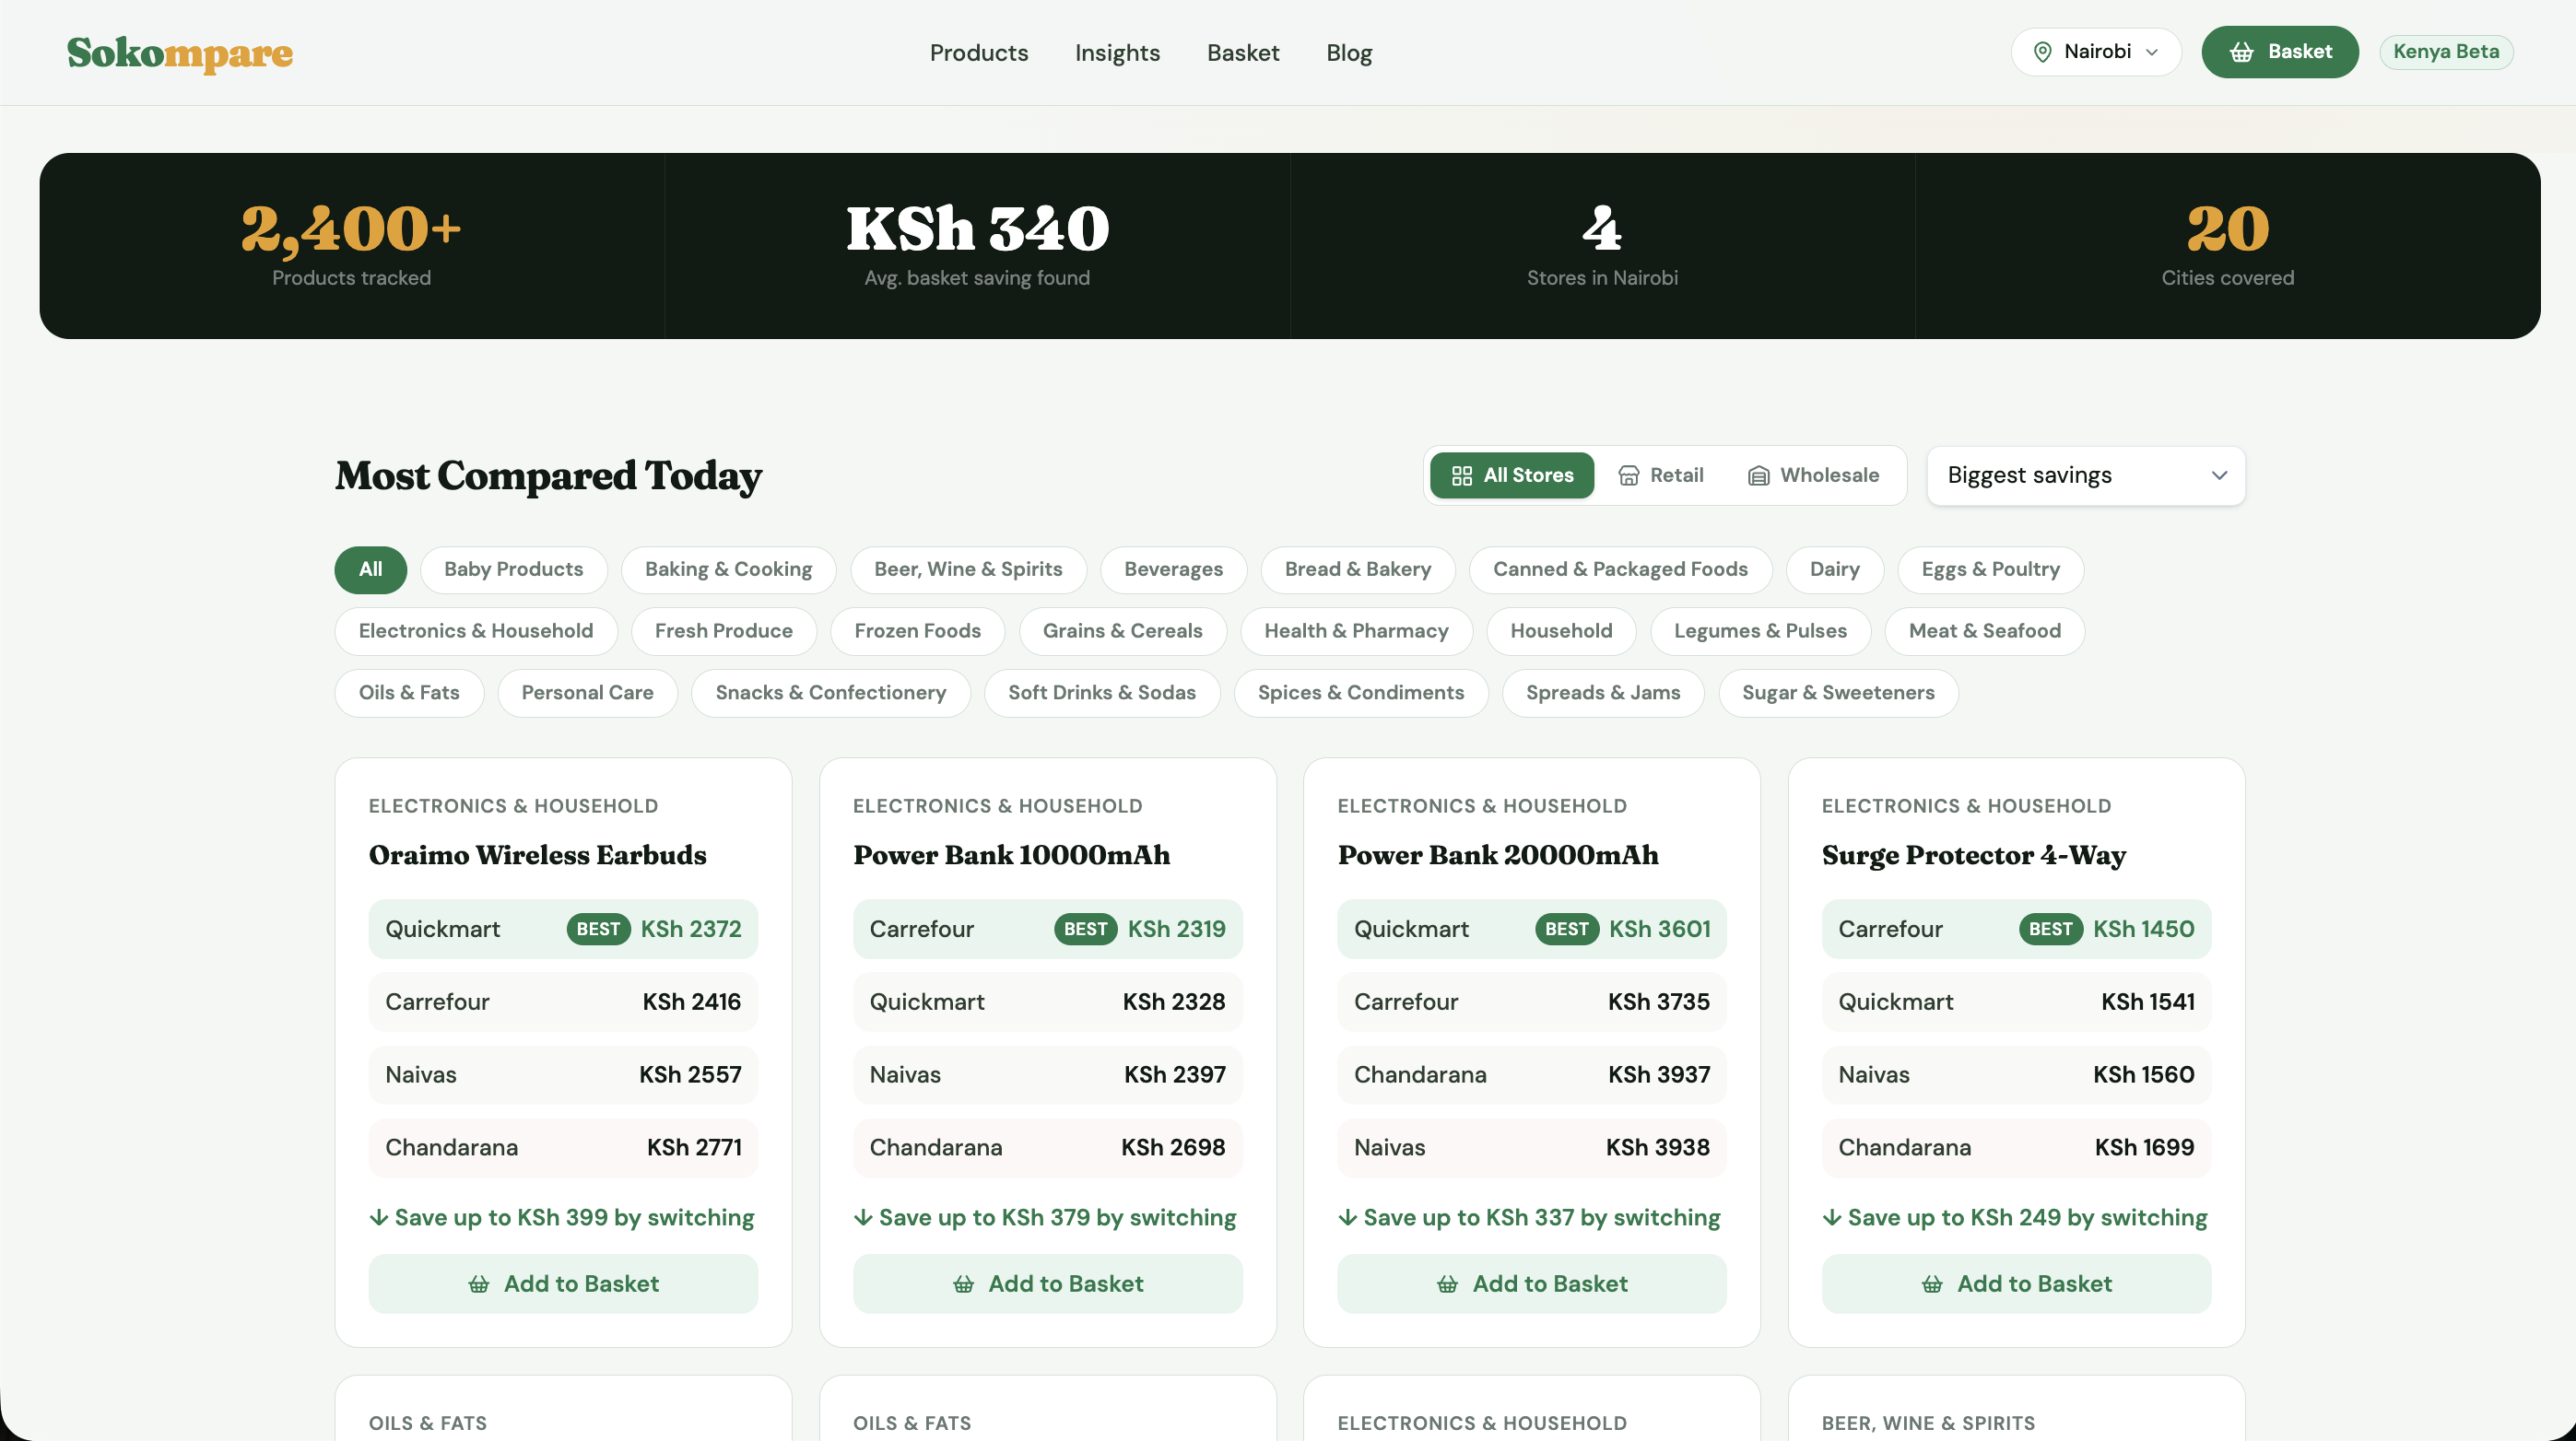
Products
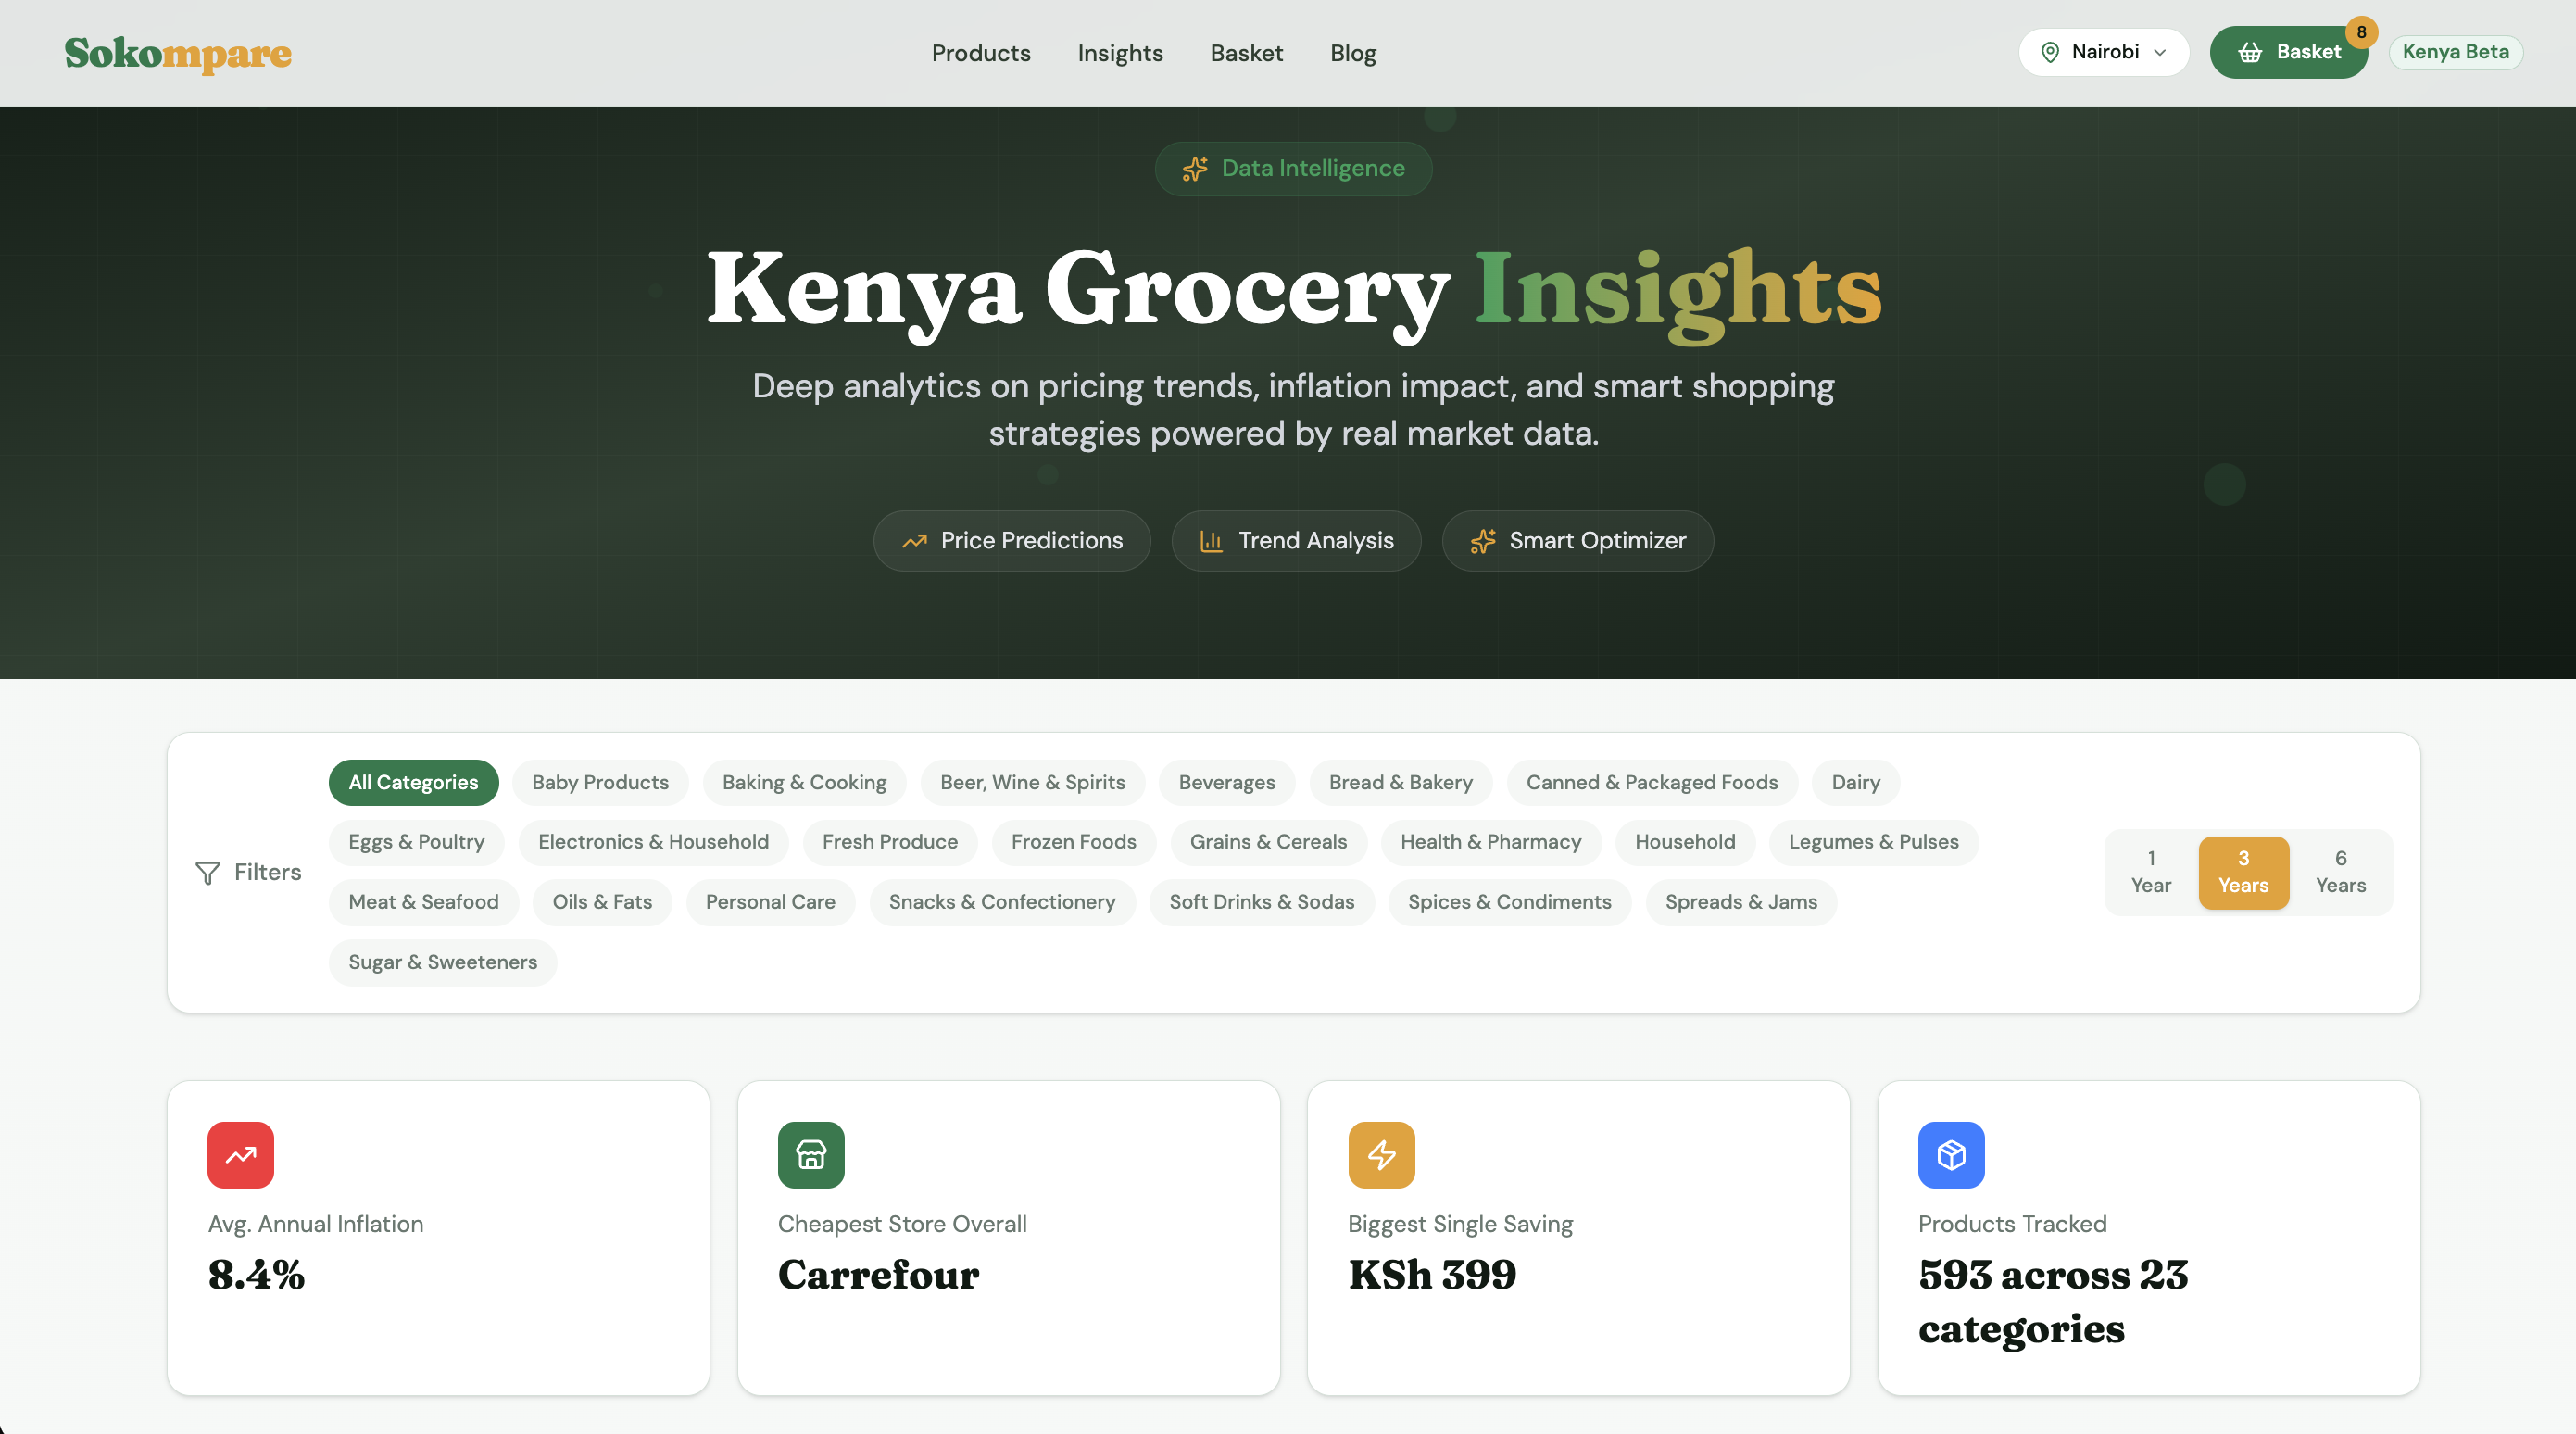
Insights
Purchasing Power
Category Heatmap
Basket
Basket Optimizer
Blog
Key Numbers
Products Tracked
593+
Categories
23
Avg. Annual Inflation
8.4%
Purchasing Power Lost
38% in 6 years
Biggest Single Saving
KSh 399
Cheapest Store Overall
Carrefour
Tech Stack
Frontend
React, Next.js
ML & Forecasting
Python, scikit-learn, Exponential Smoothing
Data Pipeline
Web Scraping, REST API
Visualization
Recharts, D3 Heatmaps
Hosting
Vercel
Analytics
Inflation Modeling, Basket Optimization